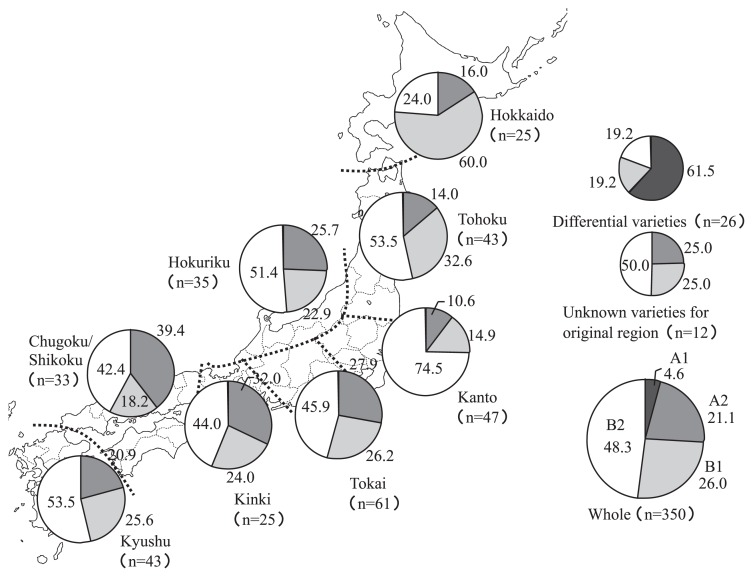
Fig. 1.
Geographic distribution of rice resistance groups in eight Japanese regions. Cluster analysis was carried out based on data on patterns of reaction to blast isolates from Japan and the Philippines, and classified into 4 groups, A1, A2, B1 and B2. Frequency of varieties in each group (no. of varieties) is shown for each region.

