
Figure 2.
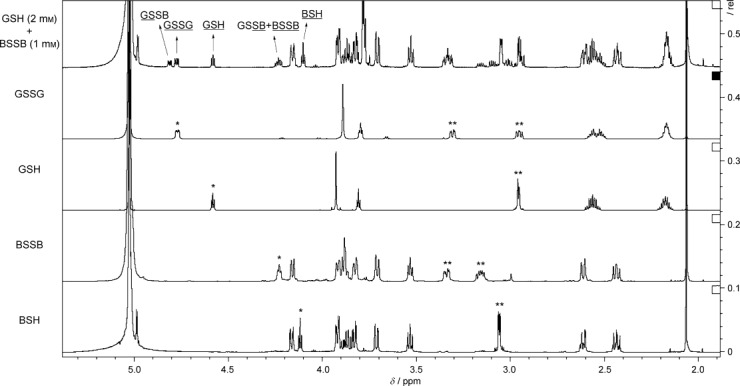
Redox potential determination. Overlay of 1H NMR spectra (pD 7.0, 5 °C, 800 MHz) for reaction between BSSB (1 mm) and GSH (2 mm) after equilibrium, together with pure samples of BSH, BSSB, GSH and GSSG. Cysteinyl protons are indicated as * CHα and ** CH2β.