
Figure 4.
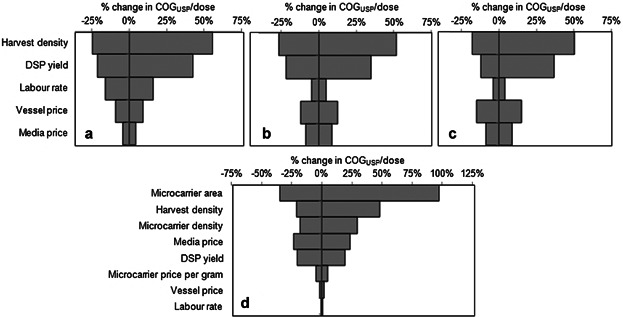
Tornado diagrams showing the sensitivity of COGUSP/dose to the key bioprocess economics model parameters. Results are shown for manufacturing scenarios where the following cell expansion technologies are used per lot in the base case scenario: (a) 74 × L-10 vessels, (b) 19 × L-40 handled by five ACFMs, (c) 8 × cL-120 handled by two ACFMs, (d) 5 × M-2000L bioreactors with microcarriers. The corresponding values of dose, demand, and lot size are: (a), (b), (c) dose = 107 cells, demand = 10,000 doses/year, lot size = 1,000 doses/lot, (d) dose = 109 cells, demand = 50,000 doses/year, lot size = 2,500 doses/lot. The base case values of each parameter are shown in Table III. For each parameter the base case values were changed by ±30% to generate the plots. The vertical axis intersects the horizontal axis at the base case value in each diagram.