Fig. 11.

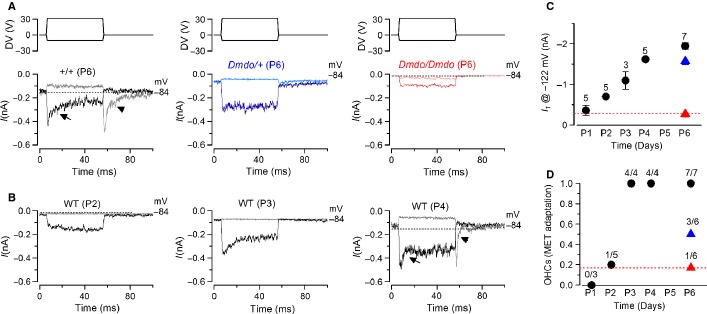
The development of transducer currents in diminuendo mutant OHCs is prematurely arrested. (A) Driver voltages to the fluid jet (top panels) and transducer currents recorded at −84 mV from a control, a heterozygous and a homozygous diminuendo mutant P6 OHC. Positive driver voltages (excitatory direction) elicited inward (negative) transducer currents that declined or adapted over time only in control OHCs (arrow). A small transducer current was present at rest (before t = 0) and inhibitory bundle displacement turned this off. Upon termination of the inhibitory stimulus, the transducer current in control OHCs showed evidence of rebound adaptation (arrowhead). (B) Example of transducer currents in developing control OHCs (P2, P3 and P4). Note that both signs of current adaptation (arrow and arrowhead) are first detected at P4. (C) Maximal transducer current recorded at different postnatal ages in control OHCs (black) and that of the heterozygous (blue) and homozygous (red) diminuendo mutant cells at P6. The number of OHCs tested is shown above each data point. (D) Extent of adaptation for small bundle deflection towards the excitatory directions (see arrows in panel A, left panel) of the transducer current at different postnatal ages in control OHCs (black) and that of the heterozygous (blue) and homozygous (red) diminuendo mutant cells at P6. The number of OHCs showing MET current adaptation over the total number of cells tested is shown above each data point. Note that (C) the size and (D) the extent of adaptation recorded in P6 homozygous diminuendo OHCs is similar to that measured in P1–2 control cells.
