
Figure 2.
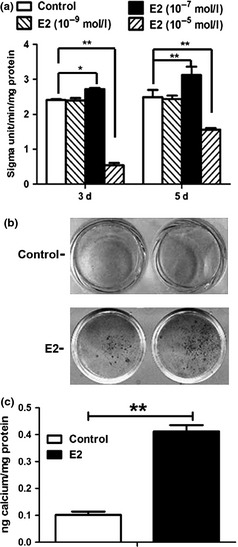
Alkaline phosphatase ( ALP ) activity and calcium deposition in E2‐treated dental pulp stem cells ( DPSC s). (a) 10−9 m E2 did not affect the ALP activity of DPSCs (P > 0.05) and 10−7 m E2 significantly upregulated the ALP levels of DPSCs at day 3 and day 5 (P < 0.05 or P < 0.01), while 10−5 m E2 significantly downregulated the ALP activity (P < 0.01), as compared with control group. Data were described as mean ± SD, n = 6. *P < 0.05, **P < 0.01. (b) Alizarin red staining assay showed that DPSCs in E2 group produced more calcified nodules than those in control group. (c) Quantitative calcium assay demonstrated the stronger calcium deposition in E2 group as compared with control group. Values were presented as mean ± SD, n = 3. **P < 0.01.