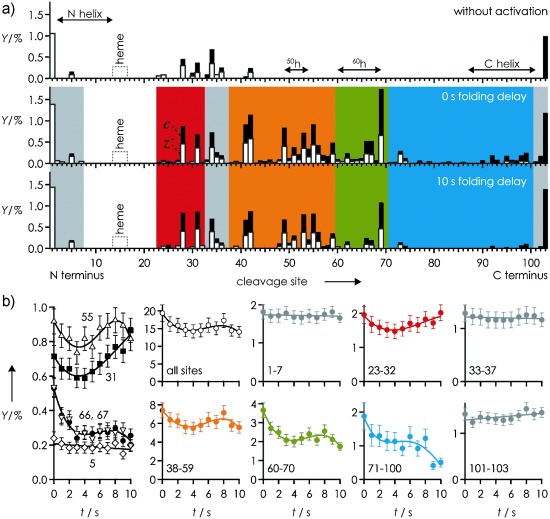
Figure 2.

a) c (black bars) and z. (white bars) fragment yields (Y) from ECD of hh Cyt c versus cleavage site without (top), and with collisional activation at 0 s (middle) and 10 s (bottom) folding delay; b) Y versus folding delay t for sites and regions as indicated; see the Supporting Information for error estimation and fit functions.
