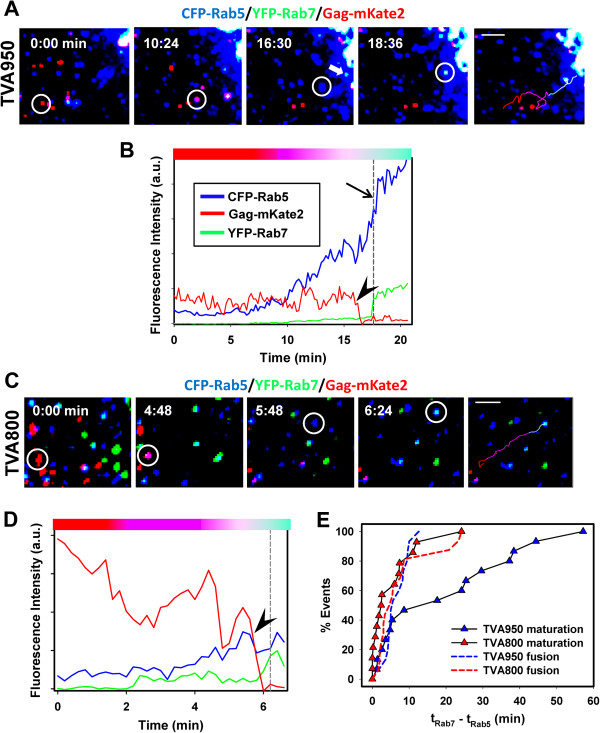
Figure 3.

Post-fusion maturation of ASLV-A-carrying endosomes. (A, B) ASLV-A (red) fusion with an early (CFP-Rab5+) endosome followed by heterotypic fusion with an intermediate (CFP-Rab5+/YFP-Rab7+) endosome in a TVA950 cell marked by arrows in panels A and B. The last image panel shows the virus trajectory colored according to the color changes corresponding to entry into an early endosome, virus fusion and then heterotypic fusion with another endosome. Scale bar 10 μm. (C, D) ASLV-A (red) fusion with an early (CFP-Rab5+, blue) endosome of a TVA800 cell followed by acquisition of YFP-Rab7 (green). The last image panel shows the virus trajectory colored according to the color changes corresponding to entry into an early endosome, virus fusion and then heterotypic fusion with another endosome. Scale bar 5 μm. (B, D) The points of mKate2 release are marked by arrowheads. The vertical dashed lines mark the acquisition of the above-threshold Rab7 signal. The colored horizontal bars above the graphs reflect the pseudocolor changes associated with virus colocalization and fusion with early or intermediate endosomes. (E) The maturation kinetics for endosomes carrying fusion-competent ASLV-A pseudoviruses in TVA800 and TVA950 cells. The lag times between accumulation of Rab5 and Rab7 signals (tRab7 – tRab5) were measured, as described in Methods and plotted as cumulative distributions. To aid comparison, the kinetics of ASLV-A fusion after entry into Rab5+ endosomes (tFusion – tRab5) are re-plotted from Figure 2B (respectively colored dashed lines).
