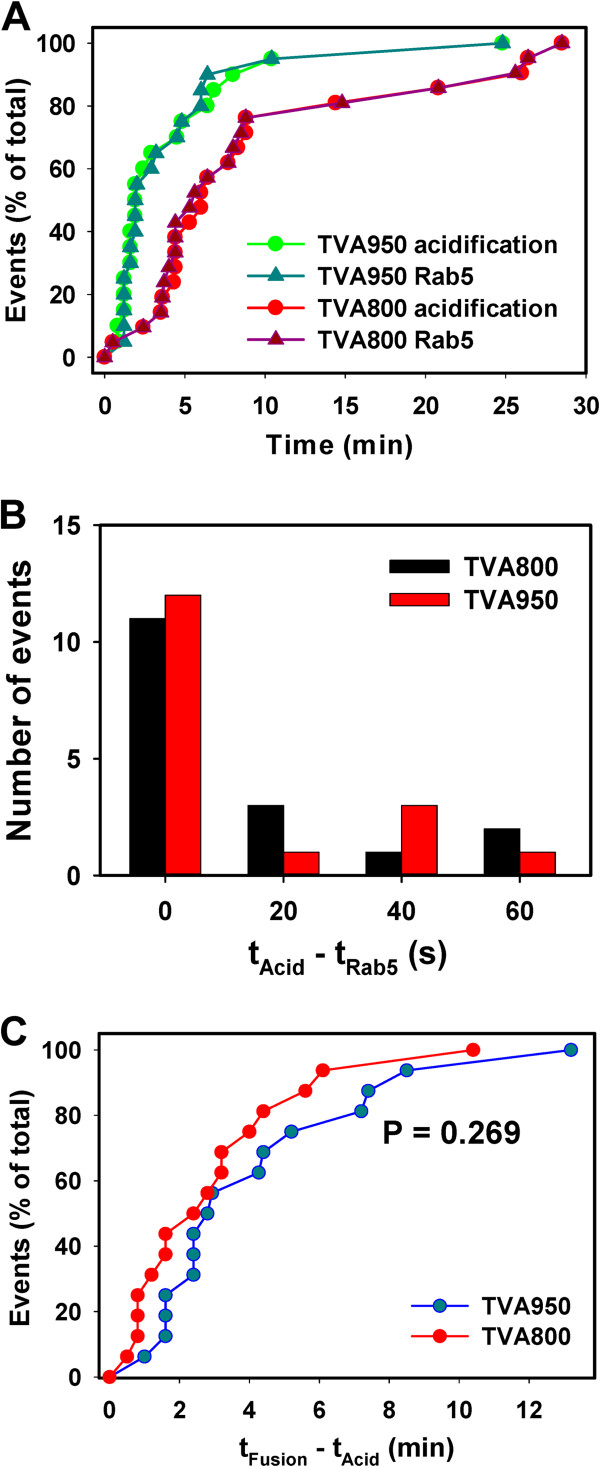
Figure 5.

Kinetics of ASLV-A entry into Rab5 positive endosomes, acidification and fusion. (A) Distribution of waiting times from raising the temperature (t = 0) to colocalization of double-labeled ASLV-A particles with the mKO-Rab5 signal (triangles) and distribution of waiting times for disappearance of the EcpH signal due acidification of endosomal lumen, (circles) in TVA800 (red/dark red) and in TVA950 (green/dark green) cells. (B) Histogram of the time intervals between Rab5 colocalization and EcpH quenching (tAcid – tRab5) in TVA800 and TVA950 cells. (C) Kinetics of double-labeled ASLV-A pseudovirus fusion measured as the time interval between the EcpH quenching (acidification) and loss of the mKate2 signal (fusion) in TVA800 and TVA950 cells.
