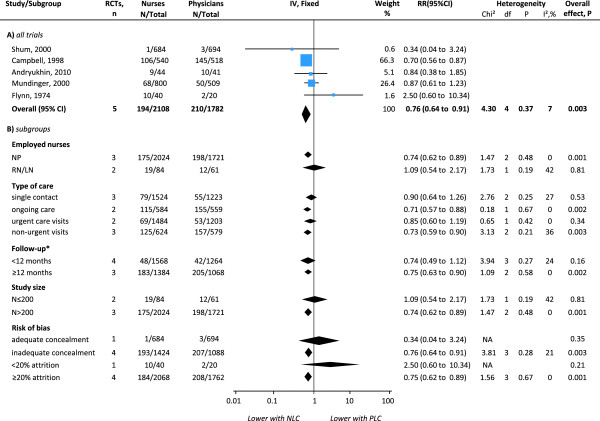
Figure 3.

Effects of physician-nurse substitution on hospital admissions in A) all trials and by B) subgroups. Legend. CI, confidence interval; df, degrees of freedom; N, number of patients with events; Total, total number of patients per group; RR, Relative Risk; Chi2, statistical test for heterogeneity; P, p-value of Chi2 (evidence of heterogeneity of intervention effects); I2, amount of heterogeneity between trials; Overall P, p-value for significance of effects of interventions; NLC, Nurse-Led Care; PLC, Physician-Led Care; NP, Nurse Practitioner; NP+, Nurse Practitioner with higher degree/courses/specialisation; RN, Registered Nurse. *Two RCTs provided data for different follow-up episodes and were incorporated accordingly: Andryukhin et al. (2010) [46] reported data at 6 and 18 months and Mundinger et al. (2000) [22,24] reported data at 6 and 12 months.
