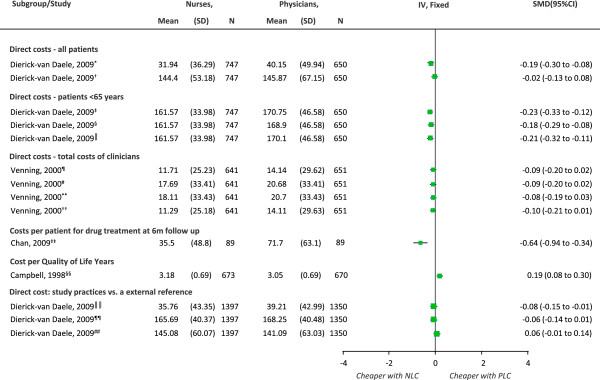
Figure 6.

Comparison of individual trial estimates of the effect of physician-nurse substitution on cost of care. Legend. A pooled estimate was not possible due to the variety in approaches, currency and indicators used to value resources and to calculate costs. Abbreviations: EUR, Euro; GBP, pound sterling; DCC, direct costs for consultations; DPCC, direct and productivity costs for consultations; general physicians (GP); EMP, employment; EMPO, employment by others; LoC, length of consultations; TCT, total consultation time; TP, time to prescribe; FTF, face-to-face; TT, total time; SD, standard deviation; N, total number of patients per group; SMD, standard mean difference; CI, confidence interval; NLC, Nurse-Led Care; PLC, Physician-Led Care. *EUR; DPCC: GPs salary in EMP and EMPO; p = 0.65. †EUR; DCC based on resource use, follow-up, LoC /salary; p = 0.0005. ‡EUR; DCC: resource use, follow-up, LoC /salary; p = 0.0001. §EUR; all patients: DPCC: GP salary in EMP and EMPO; p = 0.0009. ║EUR; <65 years: DPCC: GP salary in EMP and EMPO; p < 0.0001. ¶GBP; return consultations, FTF time: NP = TCT - TP (GP signed); GP = TCT - TP; p = 0.11. #GBP; initial consultations, TT: NP = TCT + TP (GP signed); GP = TCT + TP; p = 0.11. **GBP; initial consultations, FTF time: NP = TCT – TP (GP signed); GP = TCT + TP; p = 0.07. ††GBP; return consultations, TT: NP = TCT – TP (GP signed); GP = TCT + TP; p = 0.16. ‡‡GBP; costs of drugs; p < 0.0001. §§GBP; mean QALYs at 48 months: SF-36 overall QoL scores; p = 0.0006. ║║EUR; DPCC: resource use, follow-up, LoC and salary; p = 0.09. ¶¶EUR; DC: resource use, follow-up, LoC and salary; p = 0.04. ##EUR; <65 years of age; DPCC: resource use, follow-up, LoC and salary; p = 0.10.
