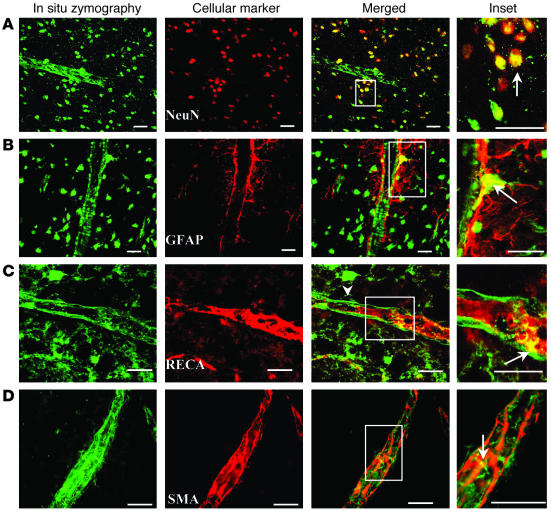
Figure 5.
CSD increased gelatinolytic activity within the vascular matrix. (A_D) Distribution of DQ gelatin_cleaving activity (in situ zymography) was compared on single sections, with the locations of cells identified by staining with specific cell markers: astrocytes, GFAP; neurons, NeuN; endothelial cells, RECA; smooth muscle cells, SMA. Cell markers were visualized by Cy-3 conjugated secondary antibody and were stained red in color. Boxed areas from merged confocal images (Merged column) are shown at higher magnification in the far right column (Inset). Gelatin cleaving activity was prominent in the walls of blood vessels and within surrounding neurons. Cleaving activity was rarely found colocalized with GFAP-positive cells. The figure shows one example. Infrequent activity was detected in endothelial cells and smooth muscle cells but predominantly within the vascular matrix. Sections were obtained 12 hours after CSD. Arrows point to areas showing colocalization. Scale bars: 20 ∝m.

