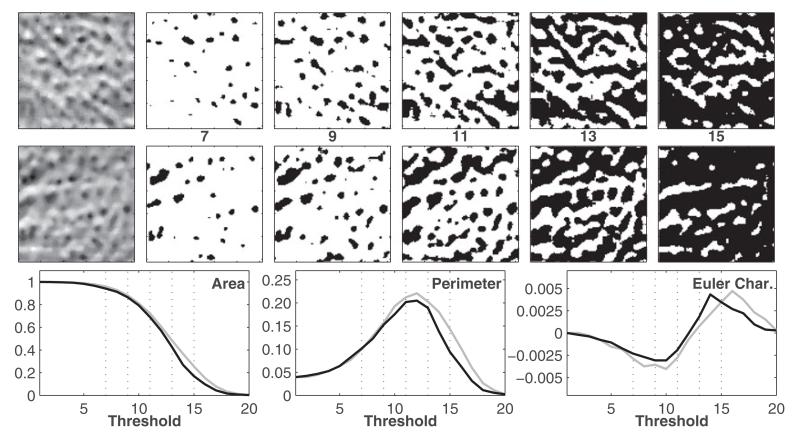
Fig. 2.
Illustration of MF. The upper and middle rows correspond to normal and osteoarthritic ROIs as shown in Fig. 1. The ROIs on the far left are binarized for five thresholds. In the bottom row, the three MF features—area, perimeter, and Euler characteristic, are plotted as a function of the threshold for the healthy (gray) and osteoarthritic (black) ROIs; the subset of the five thresholds (of 20) used to create the binary images are marked as vertical-dotted lines. These curves depict the morphological properties of the binary images and distinguish between healthy and osteoarthritic patterns.

