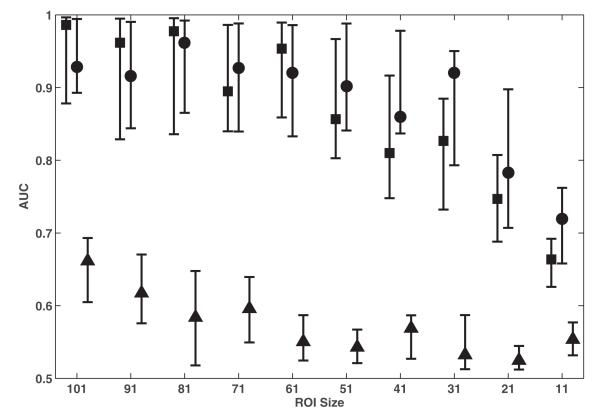
Fig. 5.
Comparison of classification performance achieved with Euler characteristic (square), correlation (circle), and standard deviation (triangle) when extracted from ROIs of different sizes. For each distribution, the central mark corresponds to the median and the edges are the 25th and 75th percentile. The best results are observed for the largest ROI size of 101 × 101 pixels; Euler characteristic and correlation exhibits the best performance when extracted from such ROIs.

