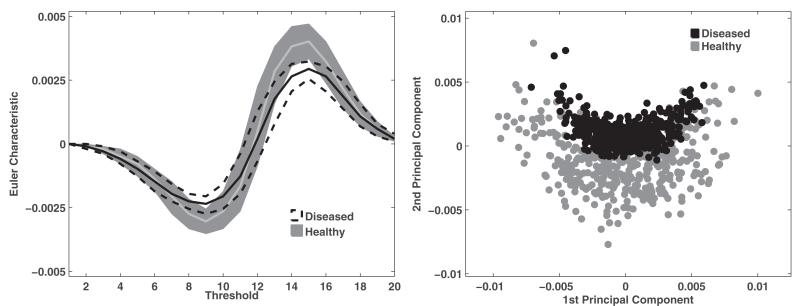
Fig. 6.
Illustration of the high-dimensional feature space of MF Euler characteristic. LEFT: The two corridors represent the Euler characteristic feature distribution for healthy (gray) and osteoarthritic (black) ROIs. Each corridor is enclosed by the standard 25th and 75th percentile as a function of the threshold; the solid lines represent the median. RIGHT: 2-D representation of the Euler characteristic feature space using the first two principal components computed from principal component analysis (PCA). As seen here, the Euler characteristic provides suitable discrimination between healthy and osteoarthritic ROIs.

