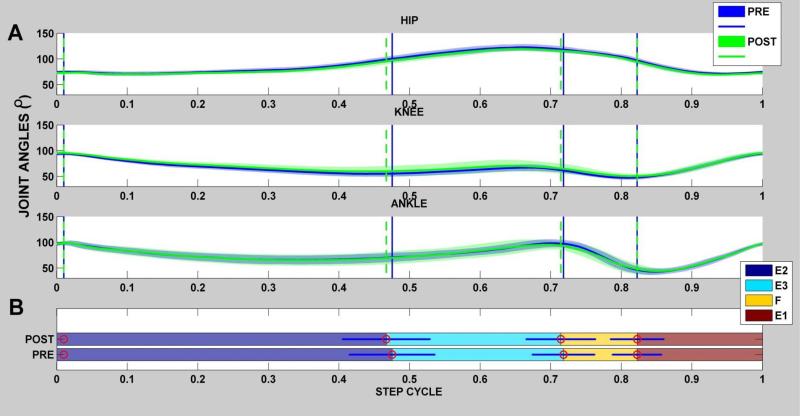
Figure 4. Hindlimb Joint Kinematics and their variations for single rat walking at the test speed (Rat N004).
Example of temporal gait measures obtained for a single rat (rat N004 )prior to (pre) and after orthotic implantation (post). A)For the pre (blue joint excursion)) and post (green excursion), all joint excursions were normalized to 1 step cycle and averaged together to yield the average joint angles as shown in the hip, knee & ankle joint plots above. in rat N004, all steps in sample records were divided into four phases (E2,E3,F,E1) and the mean duration for each phase was determined as shown by vertical lines in the joint angle plots in ‘A’. The Horizontal bar plot shows the mean percentage of each phase's contribution to the whole step cycle and analyzed for the averaged step cycle for each rat. Significance was set at p< 0.05. As shown the duration of each phase was not significant in the pre and post conditions in this rat.

