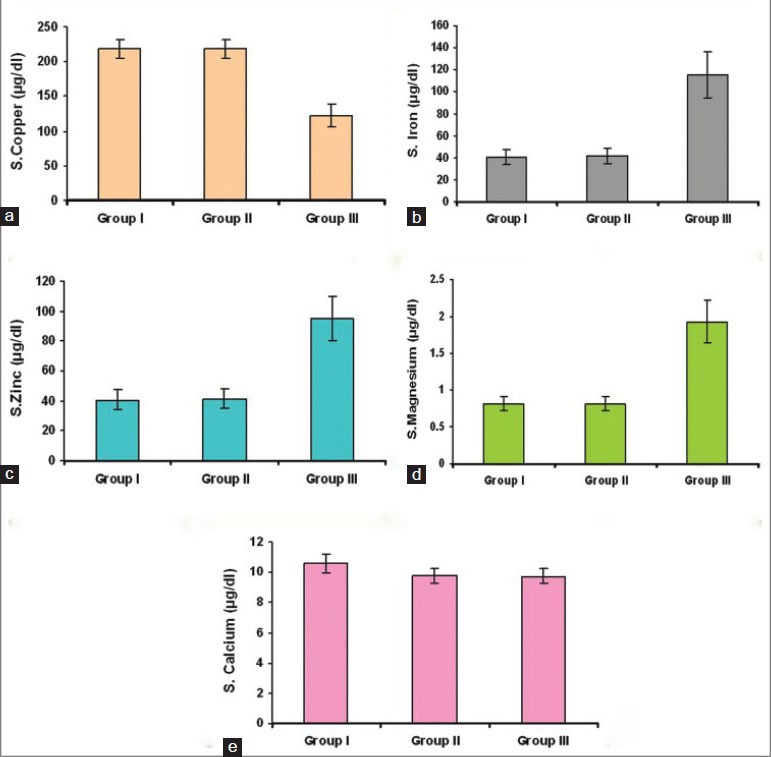
Figure 1.

(a) Bar diagram showing serum levels of copper in the three groups, (b) Bar diagram showing serum levels of iron in the three groups, (c) Bar diagram showing serum levels of zinc in the three groups, (d) Bar diagram showing serum levels of magnesium in the three groups, (e) Bar diagram showing serum levels of calcium in the three groups
