Figure 2.

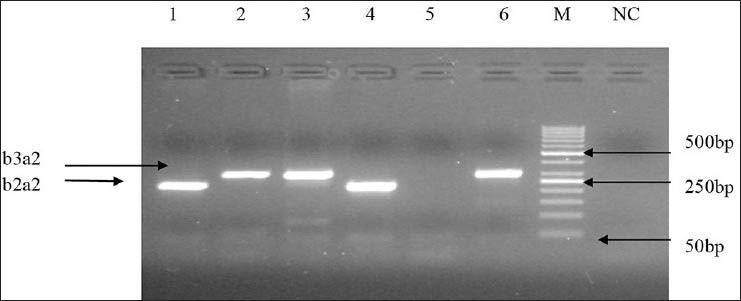
Agarose gel showing two types of characteristics breakpoint cluster region-abelson transcripts b2a2 (lanes 1, 4) and b3a2 (lanes 2, 3, 6), 234 bp and 305 bp respectively (M: 50 bp deoxyribonucleic acid ladder, NC: Negative control)

Agarose gel showing two types of characteristics breakpoint cluster region-abelson transcripts b2a2 (lanes 1, 4) and b3a2 (lanes 2, 3, 6), 234 bp and 305 bp respectively (M: 50 bp deoxyribonucleic acid ladder, NC: Negative control)