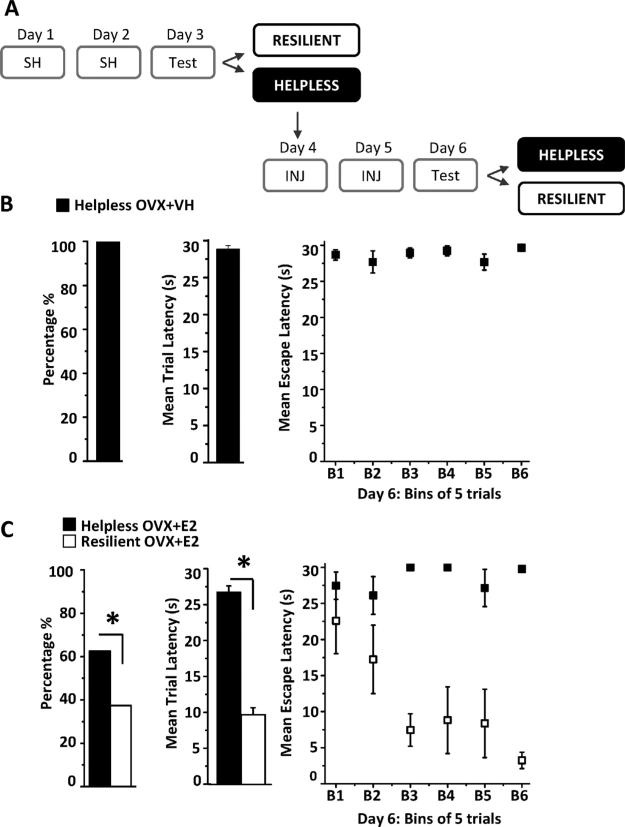
Figure 5.
E2 replacement can reverse previously established helpless behavior. (A) Experimental paradigm. (B and C) Left bar chart shows the percentage of helpless rats that remain helpless following a 2nd round of escape testing on Day 6. Middle bar chart shows the average escape latency from all 30 trials during escape testing on Day 6. Right graph shows escape latency where each bin is an average of 5 consecutive trials across the 30 trials. All vehicle-treated rats (n = 17 of 17) remained helpless while only 62.5% of E2-treated rats were helpless and 37.5% were resilient (6 of 16 rats). In the E2-treated group, mean escape latency significantly decreased during the 2nd round of escape testing on Day 6 due to some rats becoming resilient and learning to escape shock. Asterisk indicates p < 0.001. Error bars represent SEM.

