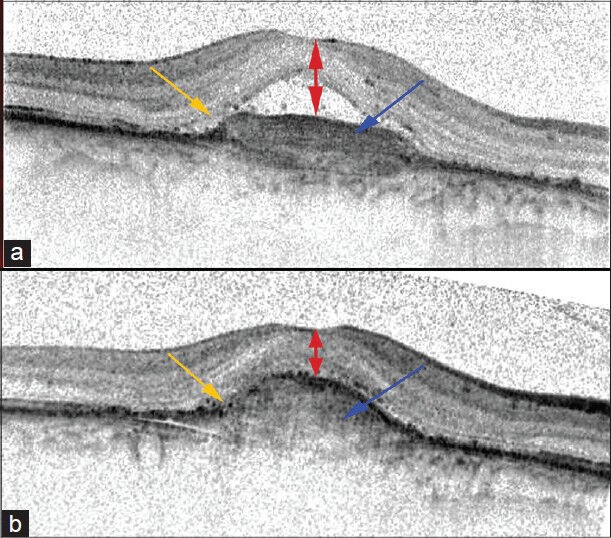
Figure 2.

Morphologic and morphometric data that we analyzed before and after anti-VEGF treatment: central retinal thickness (double-head red arrows), fibrosis (blue arrow) and photoreceptor layer defects (orange arrow). “A” shows the pre-treatment B-scan, and “B” is the B-scan of the same area 12 months after treatment began
