Figure 1.

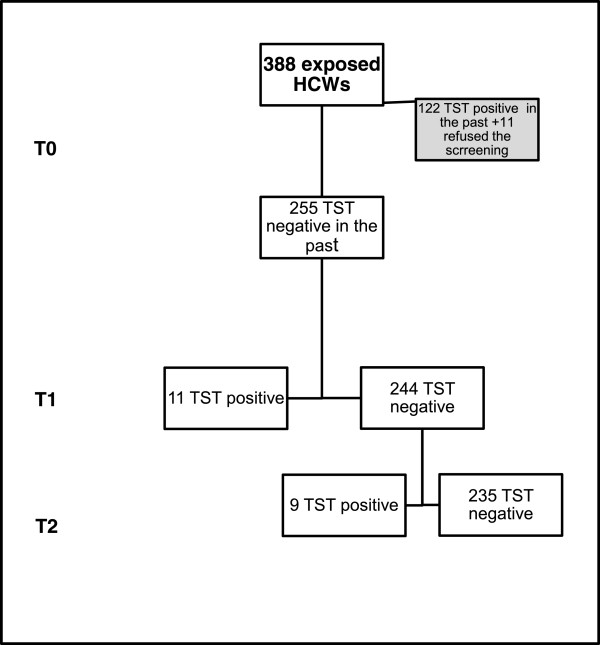
Flow chart summarizing HCW screening procedures. T0: TST result in the past (mostly at hiring), T1: TST result at exposure, T2: TST result 3 months after exposure.

Flow chart summarizing HCW screening procedures. T0: TST result in the past (mostly at hiring), T1: TST result at exposure, T2: TST result 3 months after exposure.