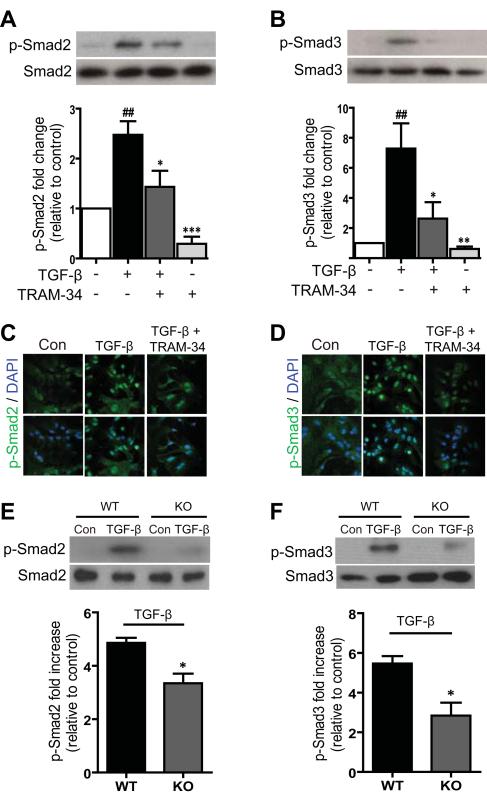
Fig. 6.
Involvement of KCa3.1 in TGF-β-induced reactive astrogliosis through the Smad2 and Smad3 signaling pathways. (A) Representative images of total Smad2 and phosphorylated Smad2 (p-Smad2) in astrocytes in control, treated with TGF-β (10 ng/ml) and TGF-β plus 10 μM TRAM-34. Mean values of p-Smad2 relative to total Smad2 (n = 3). (B) Representative images of total Smad3 and phosphorylated Smad3 (p-Smad3) in astrocytes in control, treated with 10 ng/ml TGF-β and TGF-β plus 10 μM TRAM-34. Mean values of p-Smad3 relative to total Smad3 protein (n = 3). Data are presented as means ± SEM. ## p < 0.01 versus control, * p < 0.05, ** p < 0.01, *** p < 0.001 versus TGF-β alone. (C-D) Astrocytes were grown on glass coverslips in medium with 10% FBS, starved overnight, and treated with 10 ng/ml TGF-β in the absence or presence of TRAM-34 for 1 h. Cells were fixed, permeabilized, and incubated with antibody to phospho-Smad2 (C) and phospho-Smad3 (D). Nuclei were stained with DAPI. Results are representative of three separate experiments. Confocal images were obtained at an original magnification of x60. (E) Representative images of total Smad2 and phosphorylated Smad2 (p-Smad2) in astrocytes from KCa3.1−/− mice, responses to TGF-β compared with astrocytes from KCa3.1+/+ mice. Mean values of p-Smad2 relative to total Smad2 (n = 3). (F) Representative images of total Smad3 and phosphorylated Smad3 (p-Smad3) in astrocytes from KCa3.1−/− mice, responses to TGF-β compared with astrocytes from WT mice. Mean values of p-Smad3 relative to total Smad3 (n = 3). Data are presented as means ± SEM. * p < 0.05 versus WT phosphorylated Smad2 or Smad3 alone. WT: wild type, Con: control, KO: knockout.

