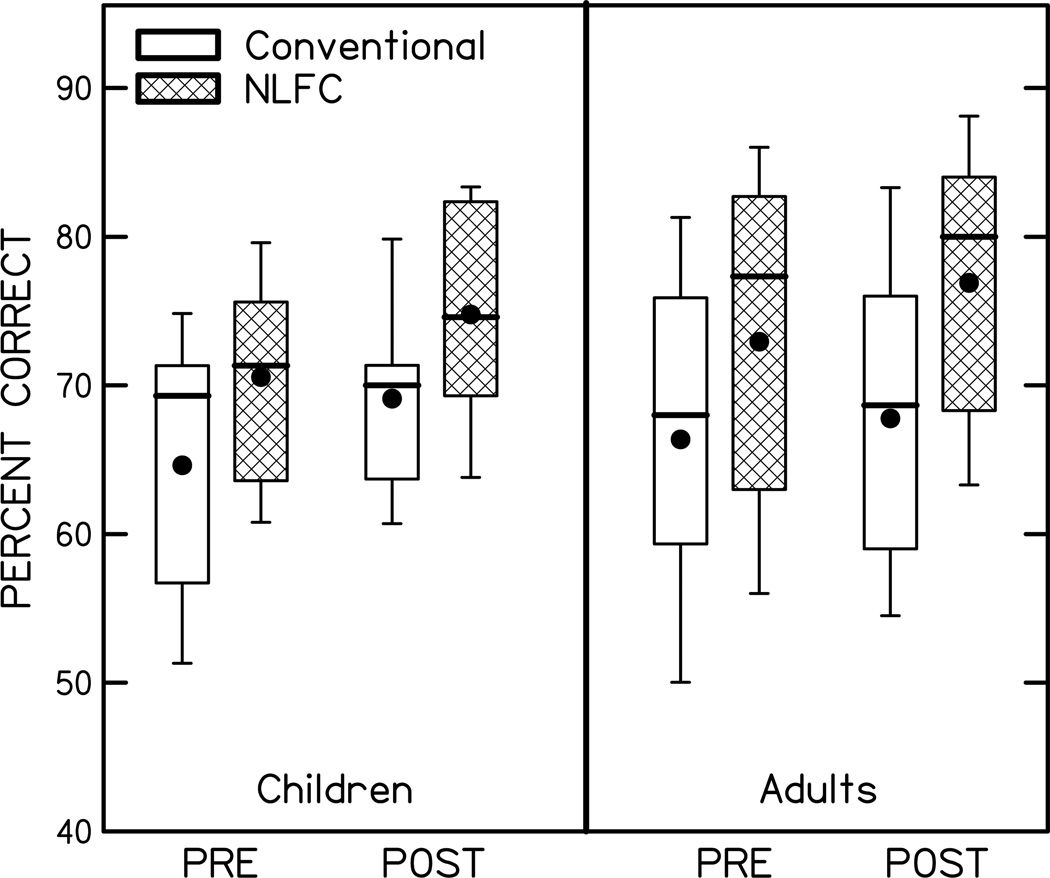
Figure 3.
Percent correct word recognition across conditions of conventional processing and nonlinear frequency compression before (PRE) and after (POST) the story processed with NFC. White box plots are conventional processing (CP), and hatched box plots are nonlinear frequency compression (NFC). Boxes represent the interquartile range (25th – 75th percentile) and whiskers represent the 5th – 95th percentile range. The mean is plotted as a filled circle for each condition, and the median is plotted as a solid horizontal line within each box.

