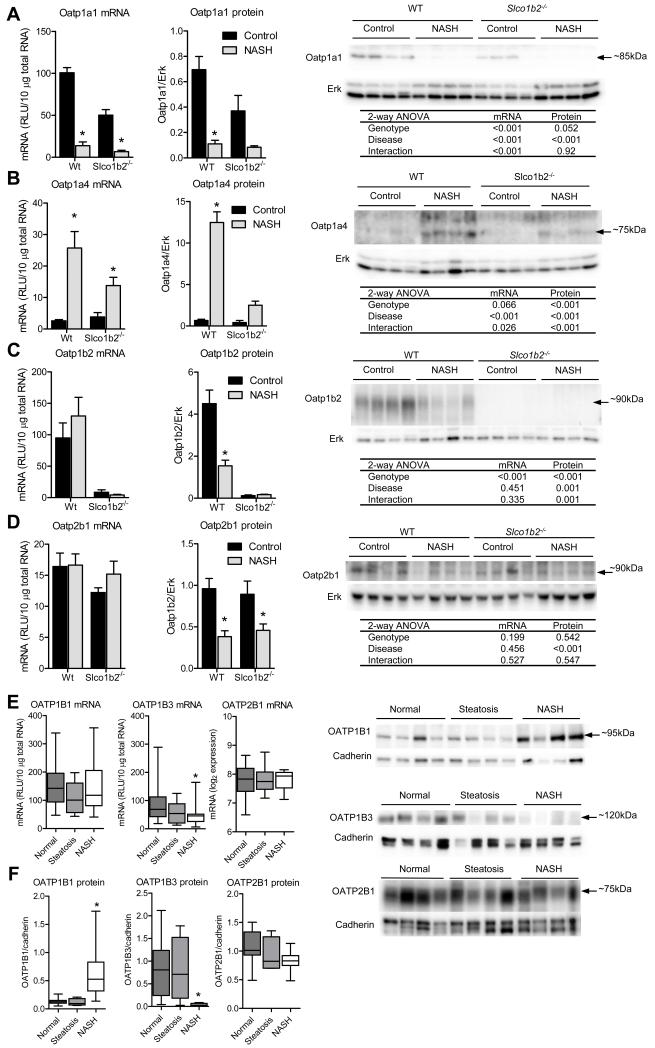
Fig. 4. Diet-induced NASH and human NASH causes altered expression of OATP transporters.
mRNA and protein expression of Oatp1a1 (A), Oatp1a4 (B), Oatp1b2 (C), and Oatp2b1 (D). Representative western blots and the Two-way ANOVA p-values are shown. *indicates a p-value <0.05 according to a Two-way ANOVA Bonferroni multiple comparison post-test. Data represent mean ± SEM. WT control n=4, WT NASH n=4, Slco1b2−/− control n=4, Slco1b2−/− NASH n=4. (E) OATP1B1, OATP1B3, and OATP2B1 mRNA expression levels in normal (n=20), steatosis (n=10), and NASH (n=19) livers. (F) OATP1B1, OATP1B3, and OATP2B1 protein expression levels in normal (n=10), steatosis (n=4), and NASH (n=12) livers. Box and whisker plots represent the median and the min and max. *indicates a p-value <0.05 according to a One-way ANOVA Dunnett’s multiple comparison post-test. Representative human OATP blots are shown on the right.

