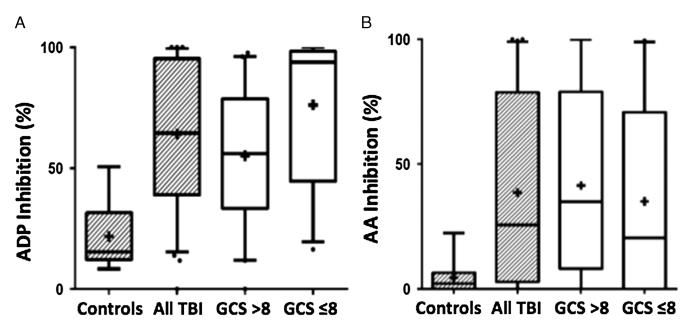
Figure 3.
Box and whisker plots of ADP and AA receptor inhibition in control versus TBI cohorts. A, ADP receptor inhibtion of all TBI is 64.5% (IQR, 39.3–95.1%, n = 70) compared with 15.5% (IQR, 13.2–29.1%, n = 10) (Mann-Whitney U-test p < 0.0001) in the healthy controls. ADP inhibition of severe TBI cohort, GCS score of 8 or lower, was 93.1% (IQR, 44.8–98.3%, n = 29) and 56.5% (IQR, 35–79.1%, n = 41) (p = 0.0006) in the cohort with GCS score greater than 8. Mean values denoted by “+.” B, AA receptor inhibition of all TBI is 25.6% (IQR, 3.1–76.7%, n = 70) compared with 2.2% (IQR, 0.0–5.8%, n = 10) (p = 0.0027) in the healthy controls. AA inhibition of severe TBI, GCS score of 8 or lower, was 14.4% (IQR, 0–62.2%, n = 29) and 40.4% (IQR, 12.9–78.9%, n = 41) (p = 0.3460) in the cohort with a GCS score greater than 8. Mean values denoted by “+.”

