
Figure 3.
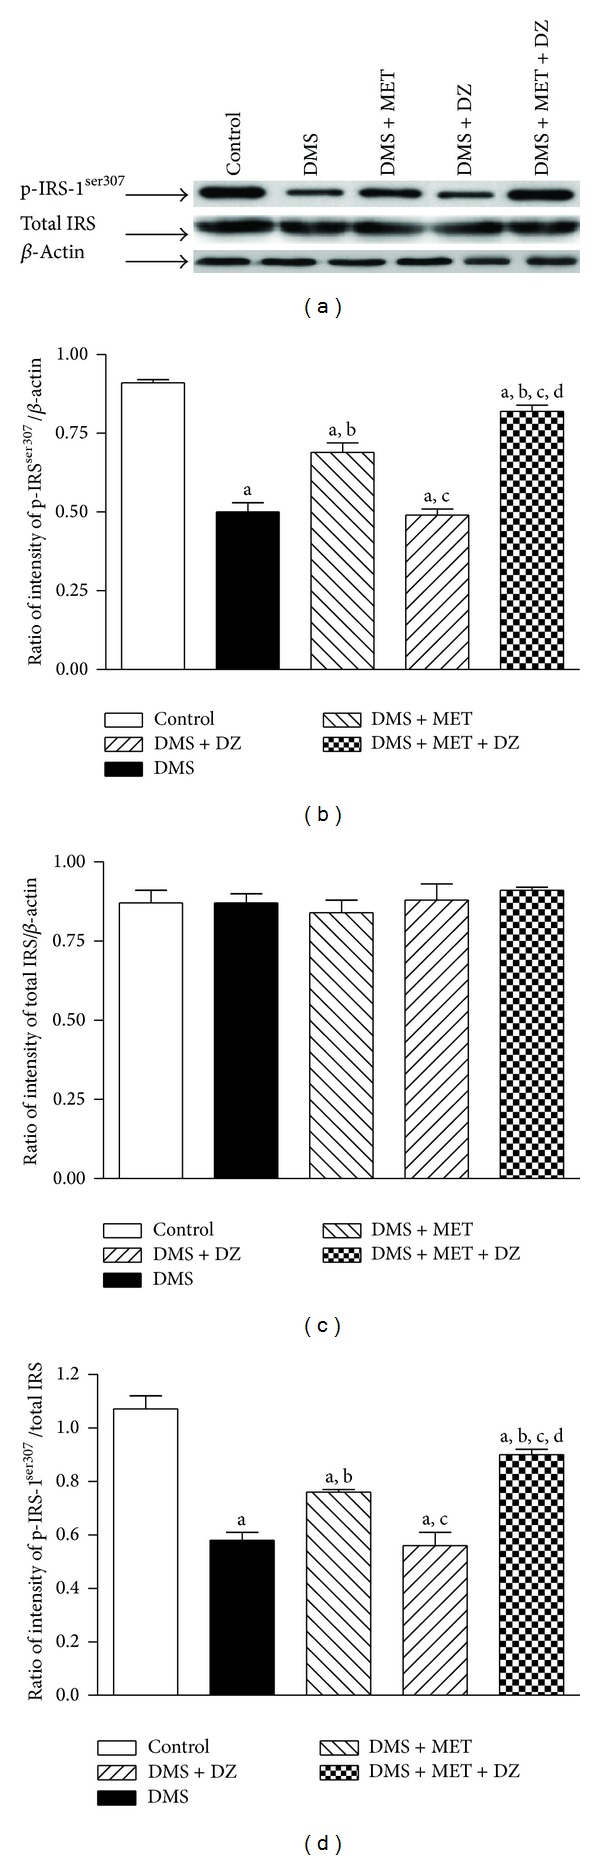
The effect of MET, DZ, and their combination on DMS-induced changes in the level of expression of phospho-IRSser307 (p-IRSser307) and total IRS in the liver tissues. The blots are representative of p-IRSser307 and total IRS (a) in the liver tissues. The results in the histogram are expressed as a ratio of relative intensity of levels of protein expression of either p-IRSser307 or total IRS to β-actin and a ratio of relative intensity of level of expression of p-IRSser307 to total IRS. All values are mean ± SEM of three separate sets of independent experiments. a P < 0.05 compared to control, b P < 0.05 compared to DMS, c P < 0.05 compared to DMS + MET, and d P < 0.05 compared to DMS + DZ (one-way ANOVA followed by Student Newmann-Keuls test).