Figure 1.

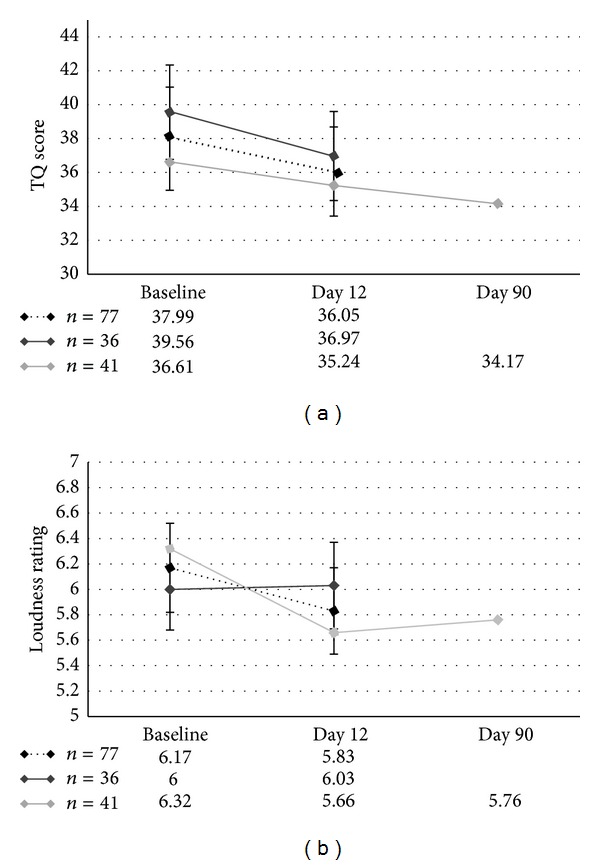
Line chart showing the time course of the TQ scores and the loudness ratings for both independent subgroups and the overall group.

Line chart showing the time course of the TQ scores and the loudness ratings for both independent subgroups and the overall group.