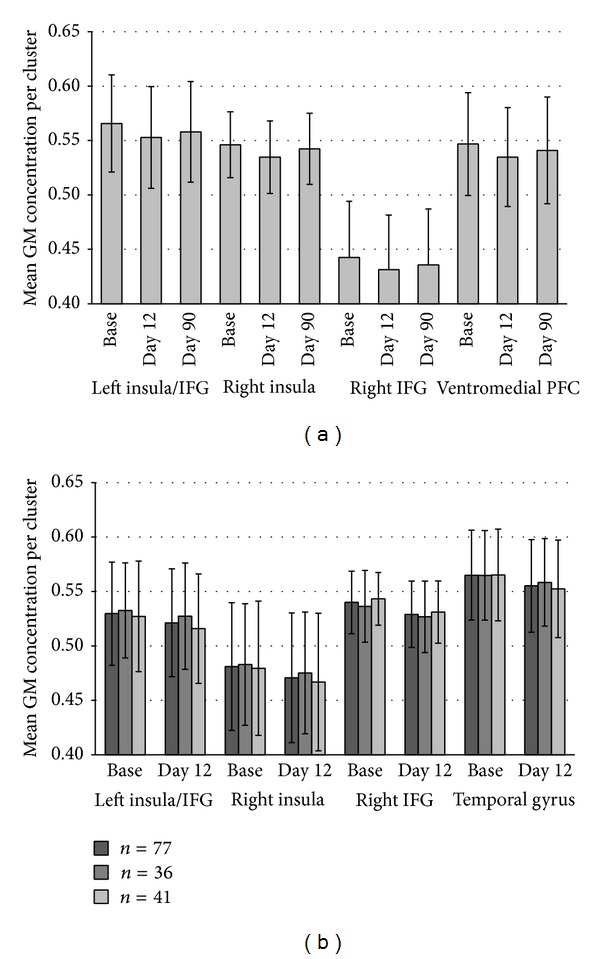
Figure 3.

Mean grey matter concentration for each time point for the clusters with significant GM changes in (a) the subgroup of 41 patients and (b) the total group of 77 patients. For the clusters of (b) the mean GM concentration is also shown for the two independent subgroups.
