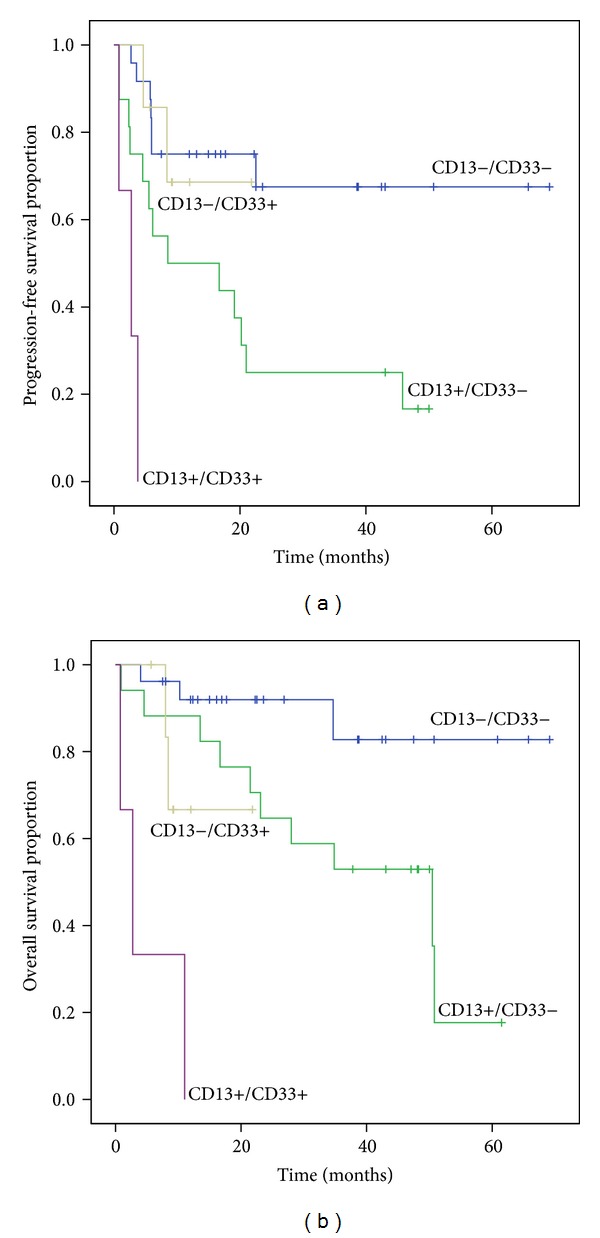
Figure 3.

Kaplan-Meier analysis of (a) PFS and (b) OS in groups of patients with CD13−/CD33−, CD13−/CD33+, CD13+/CD33−, and CD13+/CD33+. The CD13+/CD33+ group showed significantly shorter PFS and OS than other groups: CD13−/CD33− group (P < 0.001 in PFS and OS), CD13+/CD33− group (P = 0.013 in PFS and P < 0.001 in OS), and CD13−/CD33+ group (P = 0.001 in PFS, P = 0.049 in OS). CD13+/CD33− group showed significantly shorter PFS and OS than CD13−/CD33− group (P = 0.006 in PFS, P = 0.020 in OS).
