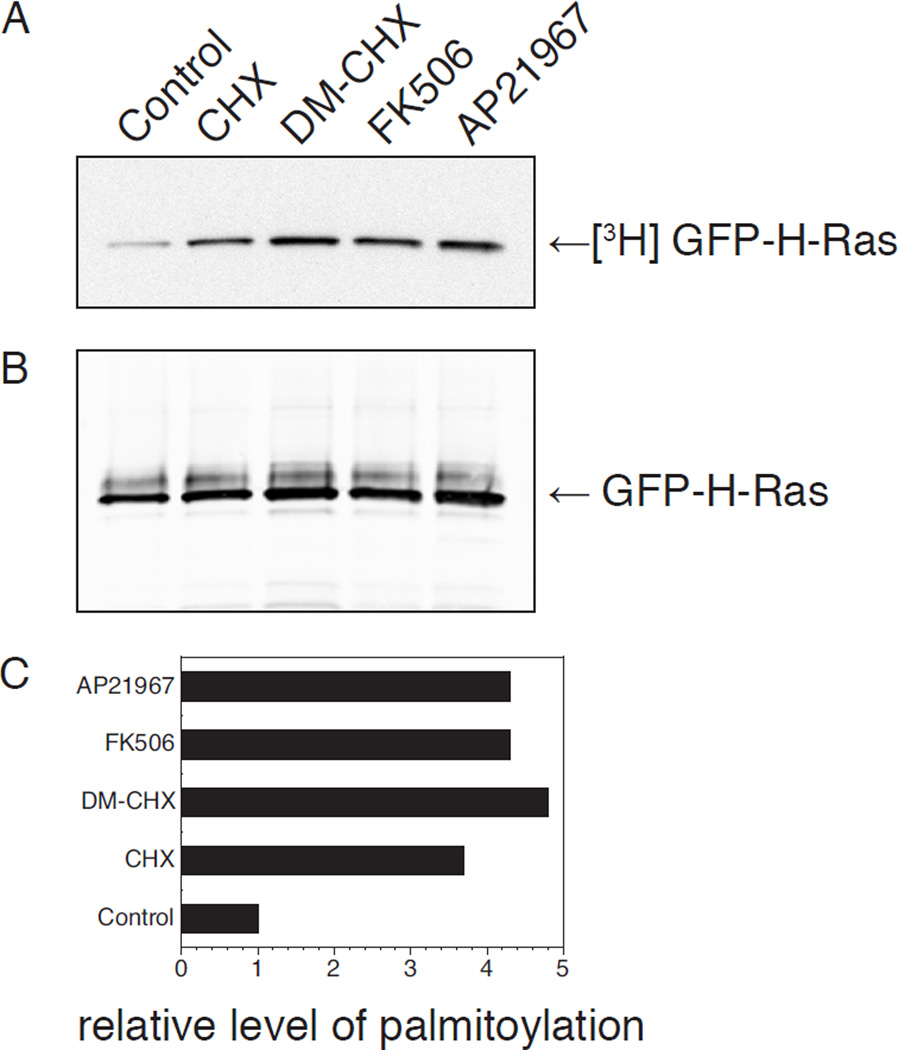
Figure 1. Steady-state metabolic labeling of GFP-H-Ras with various drug treatments.
COS-1 cells were transfected with GFP-H-Ras and labeled with [3H]palmitate while being treated either with DMSO (control), 50 ng/mL cyclohexamide (CHX), 10 µM DM-CHX, 1 µM FK506, or 2 µM AP21967. Cells were lysed the following day in RIPA buffer. Cell lysates were immunoprecipitated for Ras and subjected to SDS-PAGE analysis. (A) Fluorogram for [3H]palmitate labeling, 1 day exposure. (B) Immunoblot for Ras. (C) [3H]GFP-H-Ras bands were quantified using ImageJ software (for fluorogram) and LiCor software (for immunoblot) and are plotted as normalized ratio. Levels indicate amount of GFP-H-Ras incorporating [3H]palmitate relative to total protein amount.

