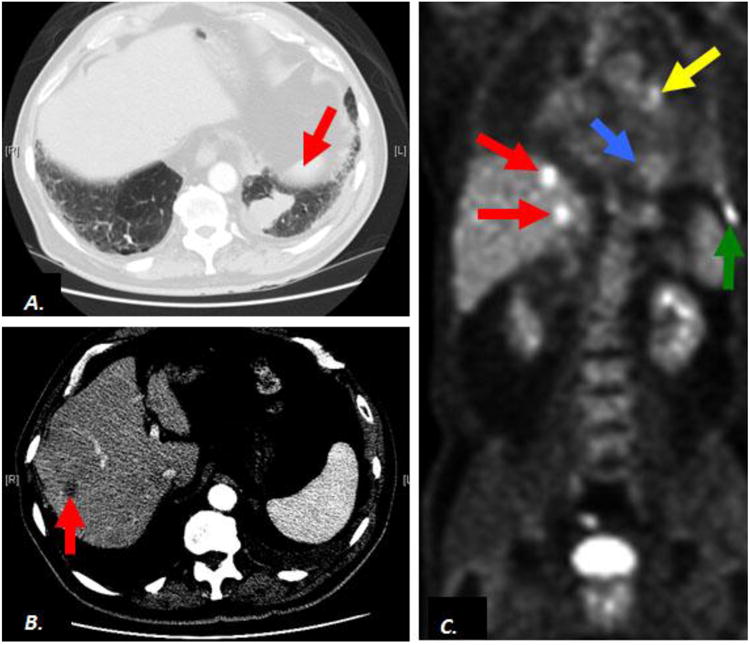
Figure 5.

Contrast-enhanced computed tomography (CT) and 18Flourine-deoxy-glucose (FDG) Positron Emission Tomography (PET scan) in a patient with metastasis of small cell carcinoma to the liver. Axial CT demonstrates a suspicious pulmonary mass In left lower lobe of lung (A, arrow) and a nonspecific liver lesion (B, arrow). Coronal FDG PET scan images confirm hypermetabolism in the lung mass (C, blue arrow), consistent with malignancy as well as hypermetabolic liver lesions (C, red arrows) consistent with metastatic disease. Additional metastatic activity corresponds to a left hilar lymph node (C, yellow arrow) and left chest wall lesion (C, green arrow).
