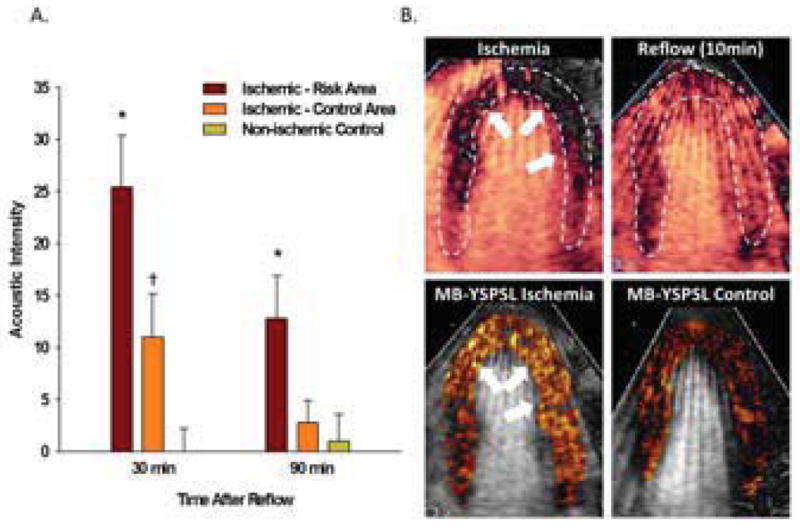
Figure 5.

Myocardial Ischemic Memory Imaging. (A) Mean (±SEM) background-subtracted acoustic intensity from MB-YSPSL in ischemic and remote territories in animals undergoing ischemia-reperfusion; and in the anterior wall in non-ischemic control animals. *p<0.05 vs remote territory and non-ischemic control; †p<0.05 vs non-ischemic control. (B) Examples of MCE images from an apical 4-chamber view from a single animal illustrate: an anterior and lateral wall perfusion defect (arrows) during LAD occlusion (top left); complete resolution of hypoperfusion 10 min after reflow (top right); color-coded images demonstrating signal enhancement from MB-YSPSL 30 min after reflow in ischemic (bottom left) and corresponding time point in non-ischemic (bottom right) primates after digital subtraction of the signal from freely circulating agent.
