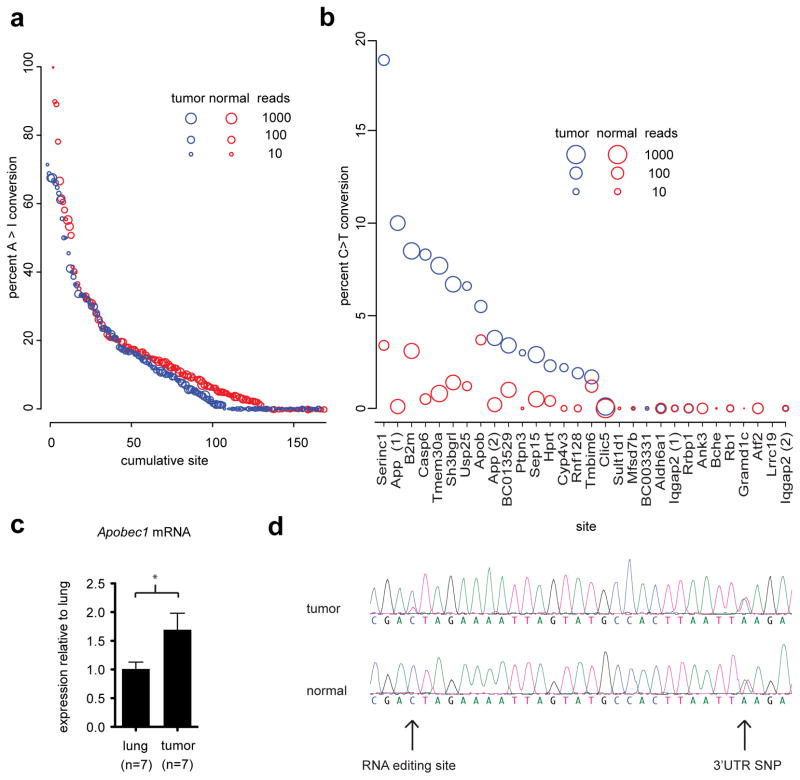
Figure 3.
Lung tumors display an increase in Apobec but not Adar RNA editing. (a) Mean percent editing for 168 previously identified Adar mediated A to I edited sites in the mouse with the size of the point reflecting the number of mapped reads at the given location. (b) Mean percent Apobec editing at 30 previously identified sites for the three samples, plotted as in panel A. (c) Apobec1 mRNA expression levels from the three sequenced mice in each condition plus tumors and normal lungs from four additional mice each, error bars represent SEM; * = p < 0.05 by t-test. (d) Sanger verification of C to T editing in the Serinc1 3′UTR. Primers were designed to amplify the edited site along with a coding SNP that indicated equal expression from both parental alleles.

