
Figure 3.
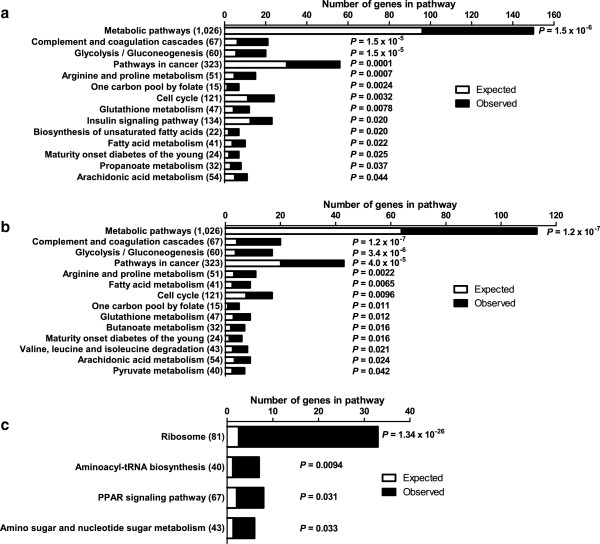
Gene set analysis of differentially expressed genes in human islets exposed to palmitate. Results of KEGG pathway analysis using a) all differentially expressed genes, b) down-regulated genes only and c) up-regulated genes only in human islets exposed to palmitate. Numbers in brackets indicate the total number of genes in the corresponding pathway.