Figure 1.

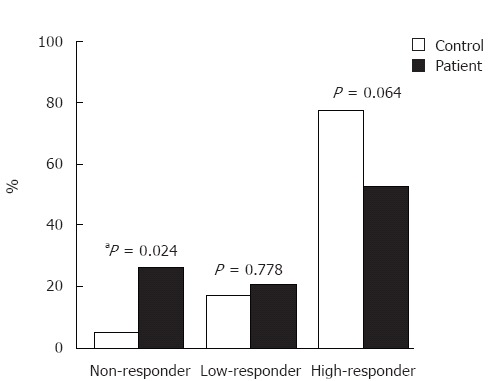
Response to HBV vaccination in patient and control groups. Non-responder (anti-HBs < 10 IU/L); Low-responder (10 IU/L < anti-HBs < 100 IU/L); High-responder (anti-HBs > 100 IU/L). aP < 0.05 vs control group.

Response to HBV vaccination in patient and control groups. Non-responder (anti-HBs < 10 IU/L); Low-responder (10 IU/L < anti-HBs < 100 IU/L); High-responder (anti-HBs > 100 IU/L). aP < 0.05 vs control group.