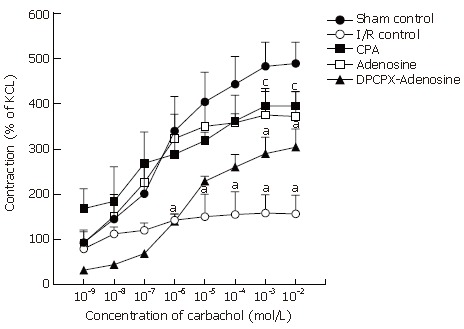
Figure 3.

Dose-response curves of carbachol in longitudinal ileum muscle isolated from sham-operated control, I/R control, CPA-I/R, adenosine-I/R, and DPCPX-adenosine-I/R rats. Data are expressed as means ± SE (n = 8). aP < 0.05 vs sham-operated control, cP < 0.05 vs I/R control groups.
