Figure 2.

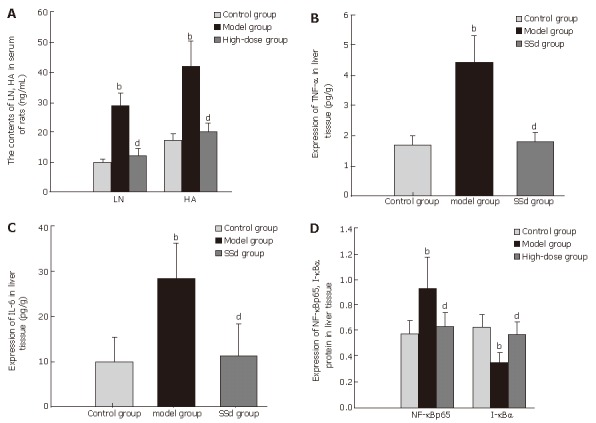
Analysis of serum LN and HA levels (A), expressions of TNF-α (B), IL-6 (C), and NF-κBp65 and I-κBα (D) in liver tissue after treatment with SSd. bP < 0.01 vs control group; dP < 0.01 vs model group.

Analysis of serum LN and HA levels (A), expressions of TNF-α (B), IL-6 (C), and NF-κBp65 and I-κBα (D) in liver tissue after treatment with SSd. bP < 0.01 vs control group; dP < 0.01 vs model group.