
Figure 4.
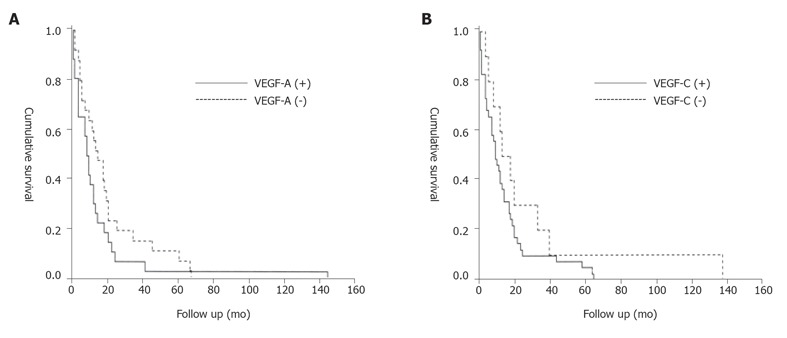
Survival curve. A: Cumulative survival (Kaplan-Meier) plot of the postoperative survival period of patients whose pancreatic tumors exhibited cytoplasmic VEGF-A immunostaining (solid line) versus those whose tumors were negative for VEGF-A (broken line), (P = 0.184); B: Cumulative survival (Kaplan-Meier) plot of the postoperative survival period of patients whose pancreatic tumors exhibited cytoplasmic VEGF-C immunostaining (solid line) versus those whose tumors were negative for VEGF-C (broken line), (P = 0.159).