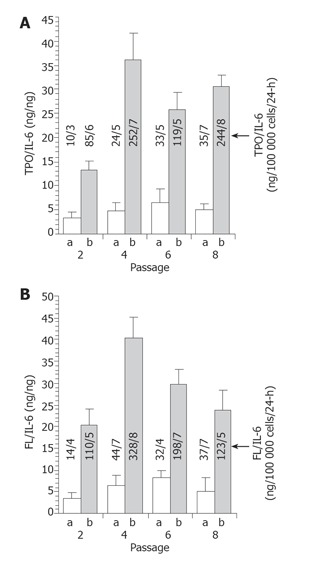
Figure 1.

Maintenance of TPO and FL production in vitro. TPO (A) and FL (B) levels secreted from tfhMSCs and untransduced hMSCs and endogenous IL-6 levels were assayed in the medium after 2, 4, 6, and 8 passages in culture. The level of TPO and FL in the supernatant was normalized to the level of endogenous IL-6 and the ratio was plotted for passage number. In addition, the absolute values (ng/100 000 cells/24 h) of TPO, FL and IL-6 are shown (arrow). Data were obtained from triplicate ELISA measurements. a = untransduced hMSCs; b = tfhMSCs.
