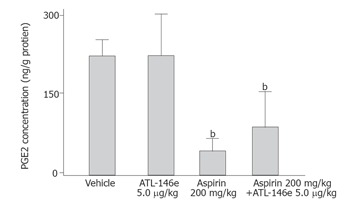
Figure 5.

Gastric mucosal concentrations of prostaglandin E2 in control group (vehicle group) and in rats treated with 200 mg/kg aspirin alone or pretreated with 5 μg/kg ATL-146e (n = 5 each group). bP < 0.01 vs vehicle treated group. NS: no significant difference between each group.
