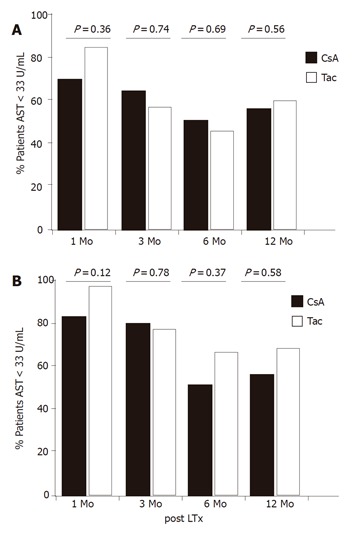
Figure 4.

Proportion of HCV-infected patients under CsA or Tac medication with normal transaminase activities at different time points post LTx. A: Percentage of patients with normal ALT; B: percentage of patients with normal and AST. P-values were calculated by x2 test.
