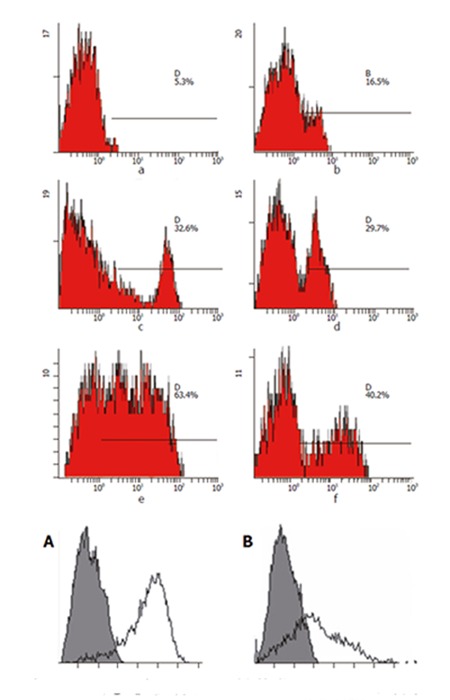
Figure 4.

CD25 expression on T cells stimulated by HepG2/mock cells or HepG2/hCD80 cells. A: T cells stimulated by HepG2/hCD80 cells; B: T cells stimulated by HepG2/mock cells. Shaded histograms show reactivity with the isotype control. Each figure is representative of at least three experiments.
