Figure 5.

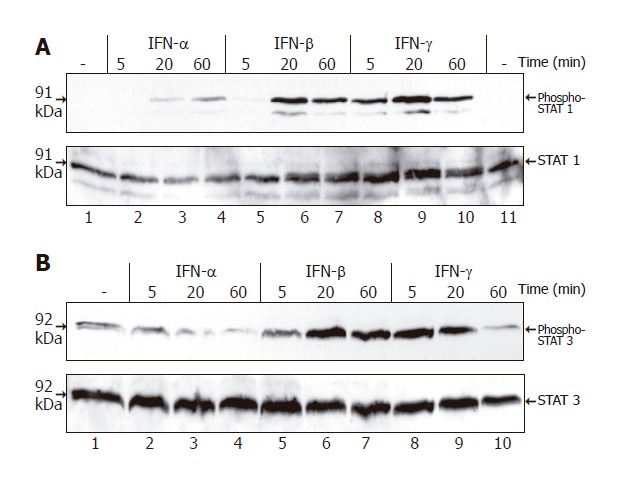
Tyrosine phosphorylation of STAT1 and STAT3 in PSCs induced by IFN. PSCs growing in 6-well plates (one passage) were treated with IFN-α (106 U/L), IFN-β (106 U/L) and IFN-γ (100 μg/L) as indicated. Cell lysates were normalized for protein concentration and resolved by SDS-PAGE. A: Tyrosine phosphorylation of STAT1 assayed by immunoblotting using an antibody specific for the tyrosine-phosphorylated protein (upper panel). To control loading, the blot was stripped and reprobed with an anti-STAT1 protein-specific antibody (lower panel); B: Immunoblot analysis performed using an antibody specific for tyrosine-phosphorylated STAT3 (upper panel) and the blot stripped and reprobed with an anti-STAT3 protein-specific antibody (lower panel). Results are representative of three independent experiments.
