Figure 6.

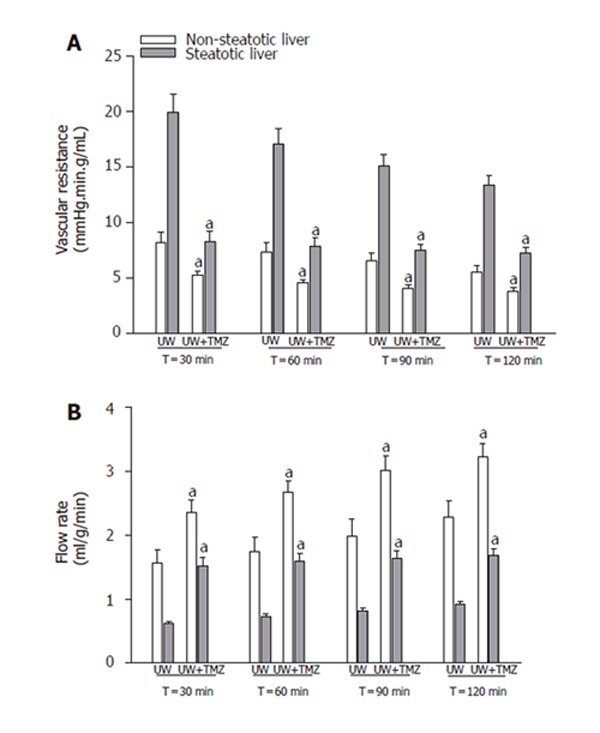
Vascular resistance (A) and perfusion flow rate (B) of steatotic and non-steatotic livers after 120 min of normothermic reperfusion. UW: livers were preserved in UW solution; UW+TMZ: liver preserved in UW with TMZ. aP < 0.05 vs UW.

Vascular resistance (A) and perfusion flow rate (B) of steatotic and non-steatotic livers after 120 min of normothermic reperfusion. UW: livers were preserved in UW solution; UW+TMZ: liver preserved in UW with TMZ. aP < 0.05 vs UW.