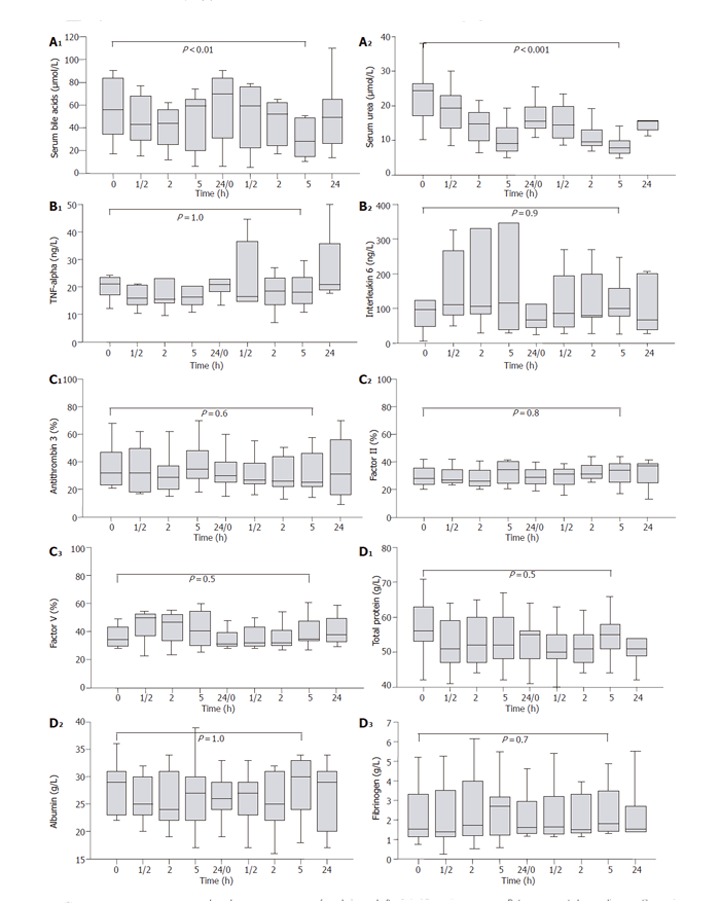
Figure 2.

(A1-A2) Course of plasma bile acids and urea concentrations before, during and after 2 d of Prometheus® therapy. Data are presented as median, quartiles, and minimum/maximum values. (B1-B2) Course of plasma TNF-α and IL-6 concentrations before, during and after 2 d of Prometheus® therapy. Data are presented as median, quartiles, and minimum/maximum values. (C1-C3) Course of antithrombin 3, factors II and V levels before, during and after 2 d of Prometheus® therapy. Data are presented as median, quartiles, and minimum/maximum values. (D1-D3) Course of plasma total protein, albumin, and fibrinogen before, during, and after 2 d of Prometheus® therapy. Data are presented as median, quartiles, and minimum/maximum values.
