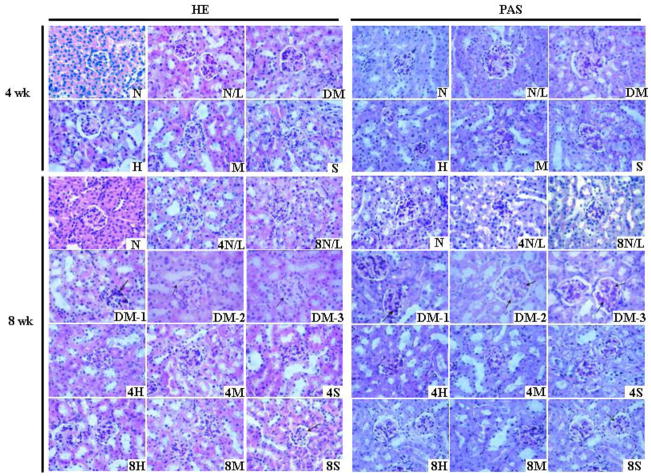
Fig. 4. Effects of different LDR regimens on diabetes-induced renal histopathological changes.
At the 4th and 8th week of the study, renal pathology of mice from each group was examined with light microscope by H&E (left panel) and PAS (right panel) staining. In the images of H&E staining, arrows in DM-1,-2 and -3 indicate increased mesangial cells, vacuolar degeneration of renal tubular epithelial cells, and glomerular and renal capsule adhesion, respectively. Arrows in 8S indicate the glomerulus with reduced pathological change. In the images of PAS staining, arrows in DM-1,-2 and -3 indicate increased PAS-positive materials, and arrows in 8S indicated reduced deposition of PAS-positive materials. In the expression of DM-1, -2, and -3, numbers of -1, -2, and -3 indicate different images from same group to exhibit the various pathological changes. “wk” indicates the time when the samples were collected and examined.

