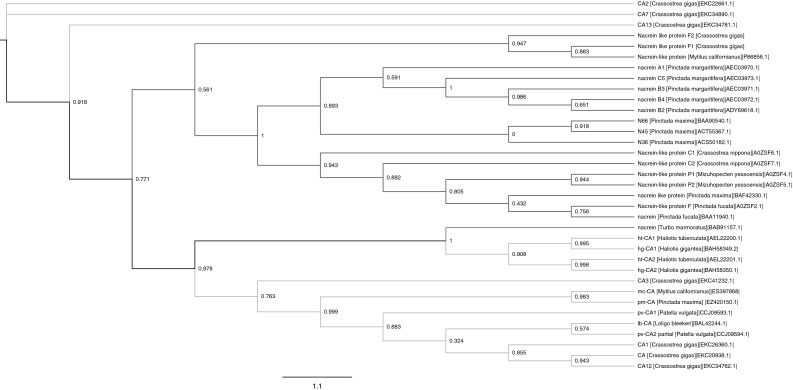
Fig. 1.

Phylogenetic relationships of 35 nacrein-like protein and CA sequences in mollusks inferred from ML analysis. The test was estimated using a WAG model (α = 0.63) via the PHYML algorithm. The scale bar indicates 1.1 substitutions per amino acid site. The target sequences in this study are highlighted in red. The blue and purple branches respectively show the nacrein-like proteins in bivalves and nacrein-like proteins in gastropods. The all CAs in mollusks are indicated in green branches
