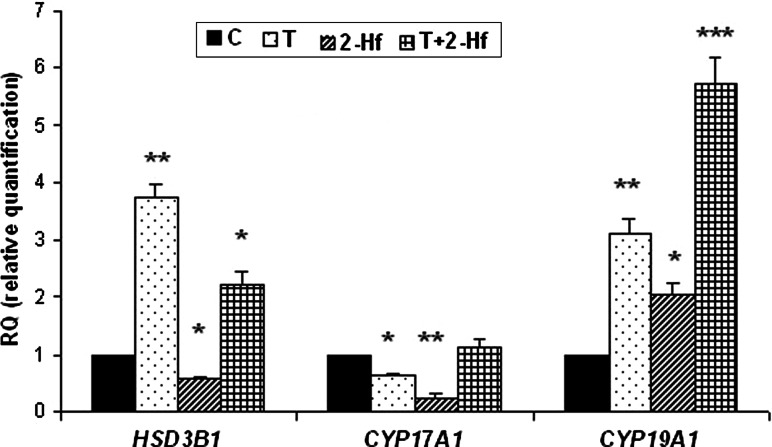
Fig. 3.
Relative expression of mRNA for 3β-HSD (HSD3B1) a, P450c17 (CYP17A1) b and P450arom (CYP19A1) c in control, testosterone (T), 2-hydroxyflutamide (2-Hf), testosterone and 2-hydroxyflutamide (T+2-Hf) treated whole follicles cultured for 24 h, using quantitative real-time PCR analysis. RQ (relative quantification) is expressed as mean ± SEM. Asterisks indicate statistically significant differences in the expression of steroidogenic enzyme genes between control and experimental groups (*p < 0.05, **p < 0.01, ***p < 0.001, Mann–Whitney’s test)

