Figure 3.
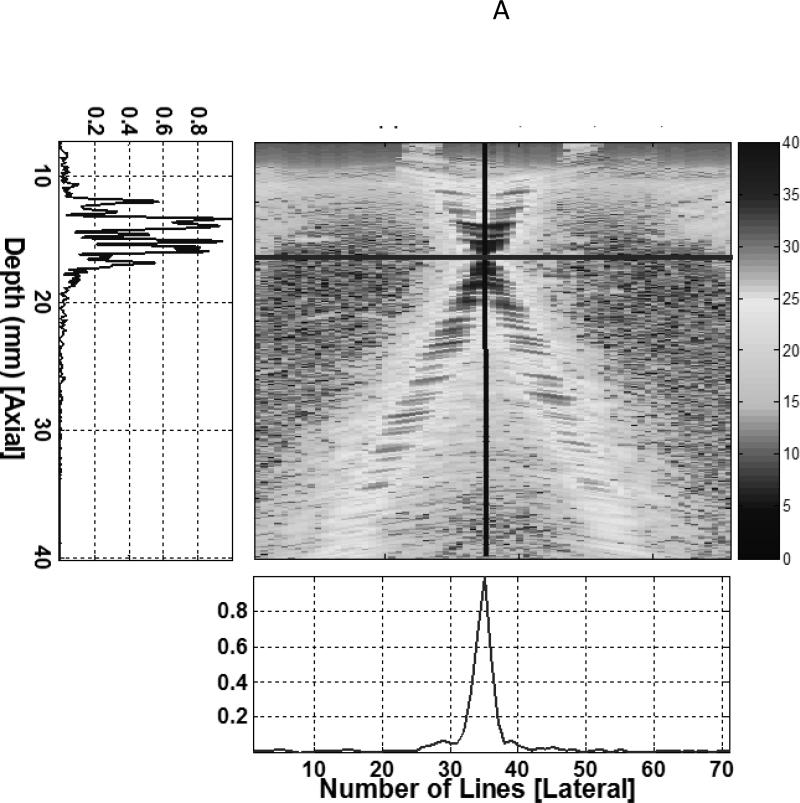
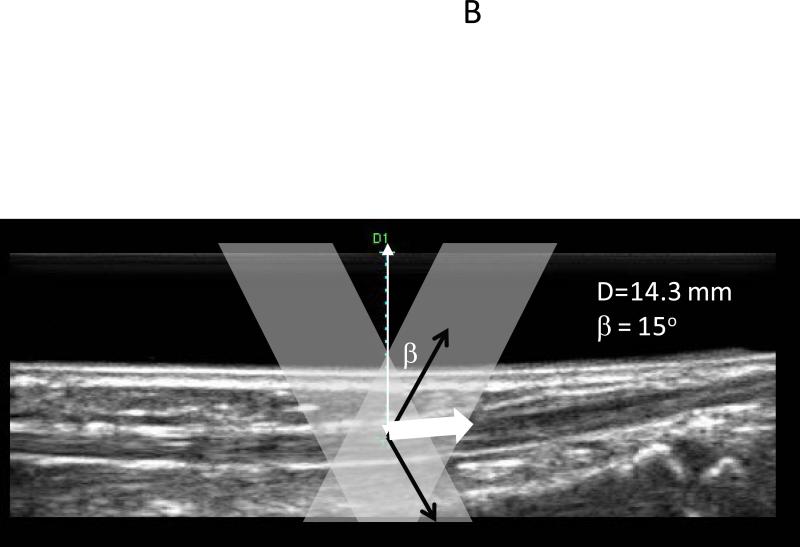
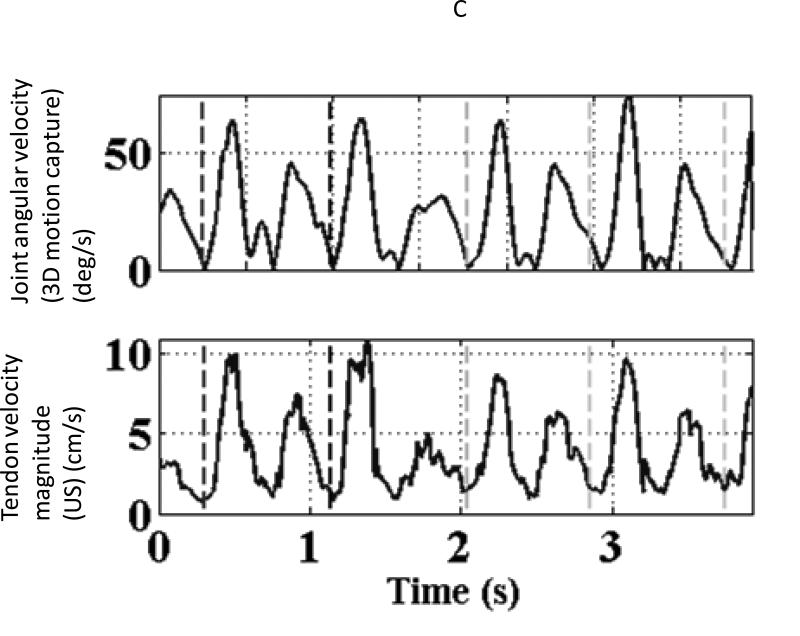
(A) The beam profiles for a vector Doppler imaging visualized using a beam profile phantom. The overlap region between the beams can be adjusted to different depths electronically by changing the separation between the two apertures. (B) B-mode image showing the anterior tibialis tendon visualized at a depth of 14 mm. The overlay denotes a schematic of the two-ultrasound beams used for vector Doppler imaging. The beams were steered at 15° with respect to the normal and velocity estimation was done using 2D Fourier transform. The individual velocity estimates (black arrows) along each beam can be combined geometrically to yield the resultant velocity vector (solid white arrow) (C) Joint angular velocities and corresponding velocity waveforms of the tibialis anterior tendon measured using vector Doppler during four cycles of dorsiflexion and relaxation. The peak magnitude of the velocity vector of the tendon is plotted, and this velocity magnitude was obtained from two separately measured components: axial (perpendicular to the ultrasound transducer) and lateral (parallel to the ultrasound transducer). The separate components are not shown. (Reproduced with permission from IEEE (14)).


