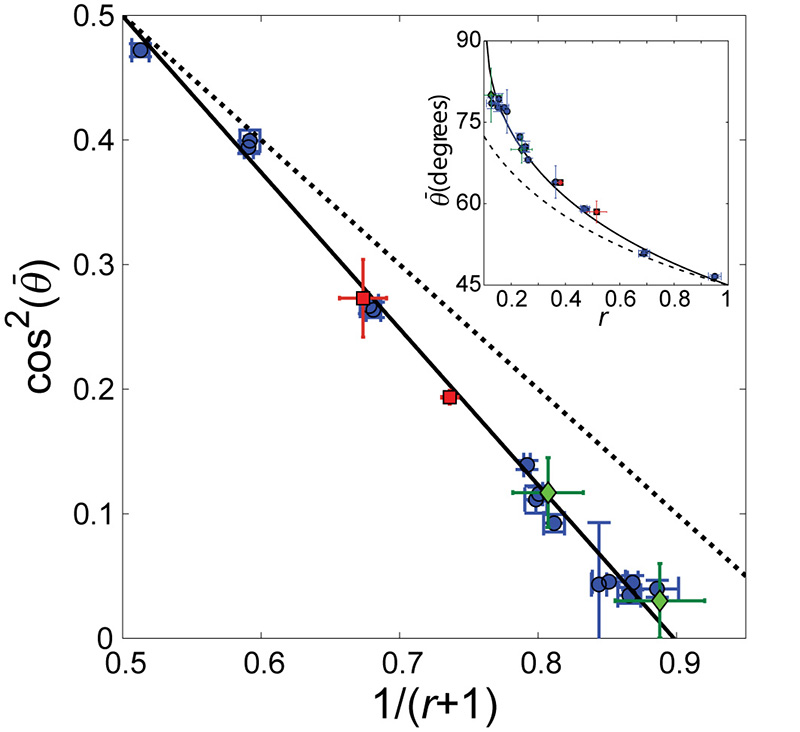
Figure 3. Final orientation angle is correctly captured by the proposed theory.
As predicted by the theory (Eq. 7), a linear relation between cos2() and (r+1)−1 is clearly observed, where is the measured final orientation angle (blue circles are data from Fig. 2c). This excellent agreement (solid black line is the best fit to Eq. 7) depends on a single parameter, b, where both the slope and the intercept are uniquely determined by it (b =1.13 ± 0.04 extracted from fit). In comparison, the zero strain prediction (Eq. 1) is depicted by the dashed black line. Additional measurements - performed on a much softer substrate (~20 kPa compared to ~1MPa) (red squares) as well as data extracted from the literature for a different cell line 14 (green diamonds) – fall on the same line. This suggests that the elastic properties, associated with the b parameter in our theory, do not depend on substrate stiffness and are possibly cell line independent. Inset shows the same data, best fit and zero strain prediction, as above, with plotted directly vs. r. Error bars represent 95% confidence intervals.

