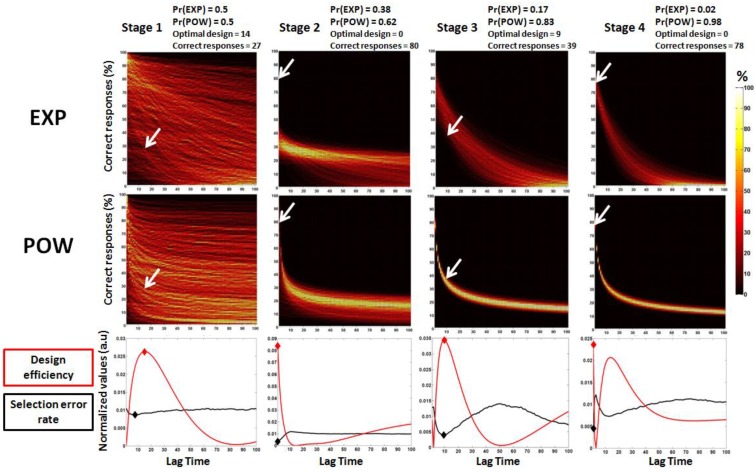
Figure 3.
Predictions of the power (POW) and exponential (EXP) models in the first four stages of one simulated experiment and the landscape of selection error rate across lag time. The predictions are based on the prior parameter estimates at each stage. The text above and inside the graphs provides information about the prior probabilities of each model, the optimal designs for discriminating the models and the observed outcomes (correct responses) at each stage of the simulated experiment. Arrows denote the percentage of correct responses at the optimal lag time. For the heat maps of models predictions (top and middle panels), yellow colors indicate regions of higher probability. (Bottom) The bottom panel, represents the error selection rate for each possible lag time (normalized values of arbitrary units, black line), as well as the estimated efficiency (red line), which is our main criterion. At each stage, we choose the maximum of our criterion (red diamond), which mostly coincides (because of the approximation) with the minimum of the error selection rate (black diamond).

